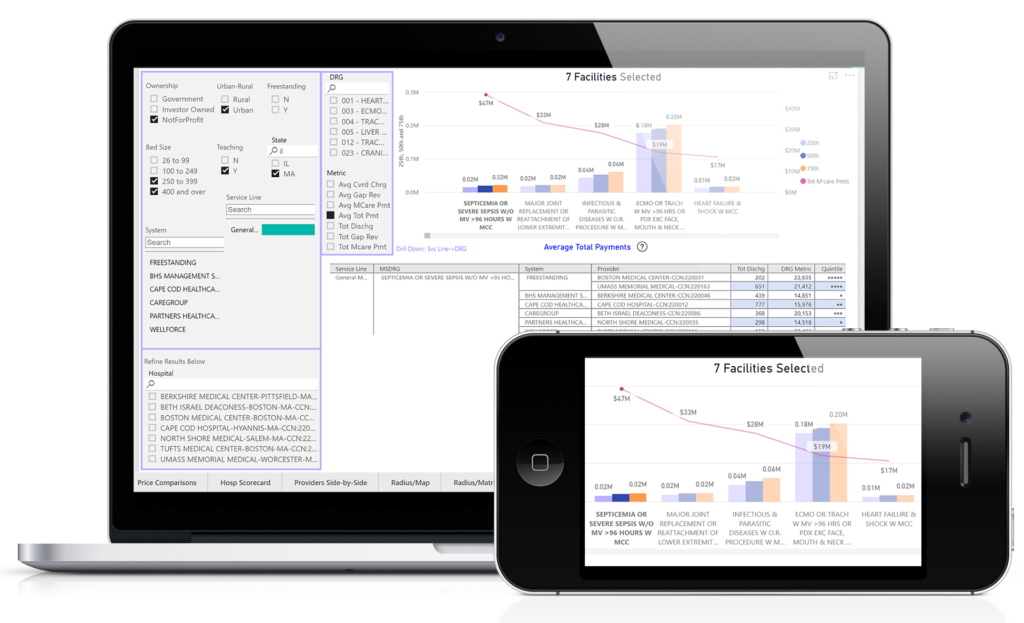
Welcome to Franklin:BI, Answers for Comparative Provider Performance.
We started with a new foundation of financial, operational and clinical performance, and maxed it out with 750 ratios & measures. The data model untangles the silos of health information and the BI platform is the latest in big data analytics. Custom metrics, peers and national standards bring providers’ experience to life. The result is an analyst’s dream.
Answers at the speed of thought!
Designing Data Assets
The keystones are the data assets, deep and broad like any hospital; organized for fast, relevant and intuitive selection & comparison. Custom metrics and exclusive ratings and rankings allow users to become the masters of answers.
The data are sourced from hospital submitted filings ensuring timely and accurate documentation about factual utilization of care services to all patients in the inpatient and ambulatory settings.
Data are based on a full census of all-payer patient activity, with some measures such as patient experience being survey-based and statistically representative of all patient activity.
The hospital database continually expands as updated data and new methods link big data files to provider performance. Data about population health, physician performance and episodes of care will link a setting longitudinally across care locations and time.
Platform Flexibility
The Franklin:BI platform is newly designed and architected to address the big data needs of today’s health systems. It continues to expand and be enhanced with interrelated data content (such as physicians affiliated with hospitals) driven by provider relationships, population-based burdens, and clinical utilization & health risk.

The Open Content Approach
The platform allows for export or extraction of data for further research and analysis, delivering an “open content” approach for teams with broader interests or data needs. Utilizing APIs that source data for Franklin Trust, the BI needs of users are kept current with timely and frequent updates to existing data along with a commitment to expand the laboratory of unexplored data.
The Technology
Franklin:BI operates in Microsoft’s Azure Cloud services utilizing Microsoft’s Power BI™ tools inside the framework of the Microsoft Azure® Trust Center, a trusted cloud service that provides embedded security and privacy, and compliance with global standards. Use of Microsoft Azure meets a broad set of industry-specific compliance standards, such as ISO 27001, HIPAA, FedRAMP, SOC 1 and SOC 2.

Artificial Intelligence: Key Performance Influencers
A.I. enhanced data discovery determines the key influences and extent for any metric’s performance among any peer group. Innovative and predictive advanced analytics offer insights that cross traditional domains of performance: finance/quality/safety/satisfaction/price/cost. It couldn’t be done without a fully integrated library of performance metrics and advanced models. In an instant, the A.I. produces insights that would take an expert programmer days to perform. No special training is needed to point and click your way through this labyrinth of insight.
Service Line Analysis with Pricing
Financial, operational and clinical performance — service line details by MS-DRG and CPT allow — custom scorecards and benchmarks for any peer group.
Mergers & Acquisitions
M&A continues to drive disruption in many markets around the country. Identify those competitors with excess capacity, assets or competitive share. Consolidate under one system for improved efficiency, payer influence and opportunities for new population health and care delivery models.
Affiliations & Network Development
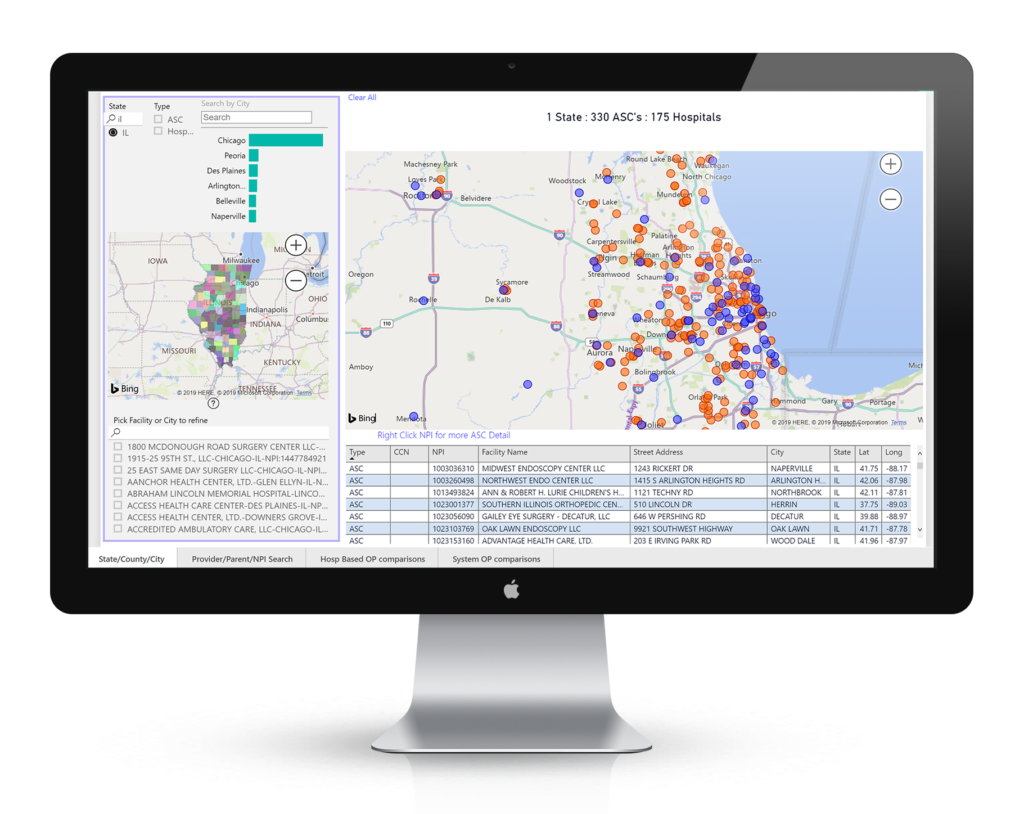
Care redesign and population health are reshaping the footprints of health systems. Inpatient, Outpatient and ASCs settings are now comingled with Urgent Care and Convenient Care making for new relationships in every market. Compete with new players as networks develop.
Strategic Market Analysis
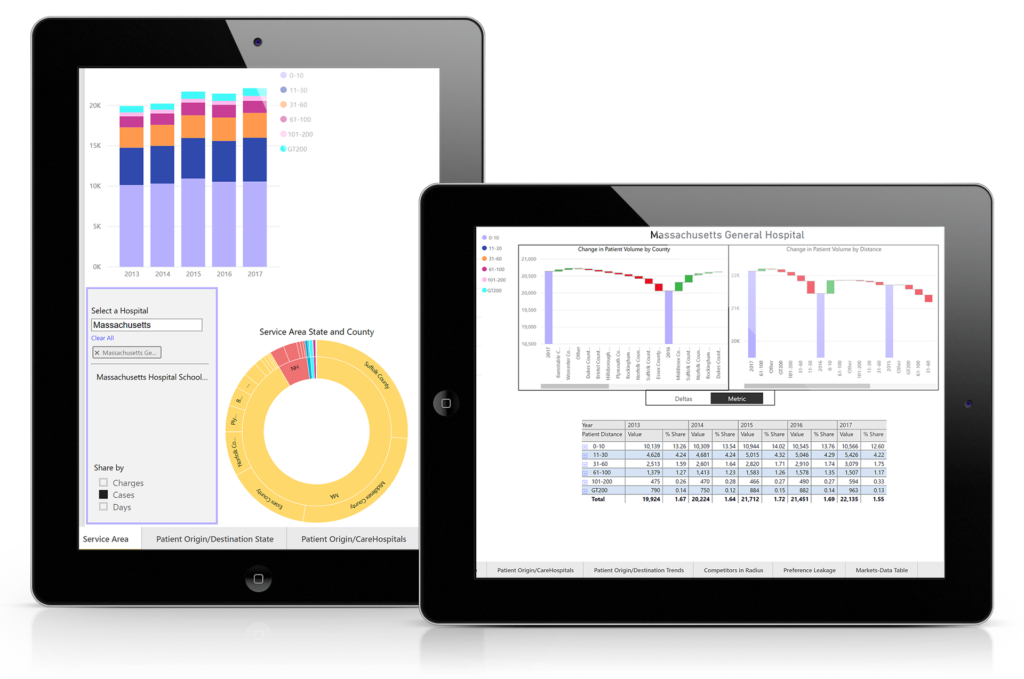
Perform a deep-dive on all providers and affiliated physicians, network providers and referring groups. Evaluate quality, safety, cost, market share, travel distance, county, city and zip origin and leakage & migration.
Peer Benchmark Analytics and Trends
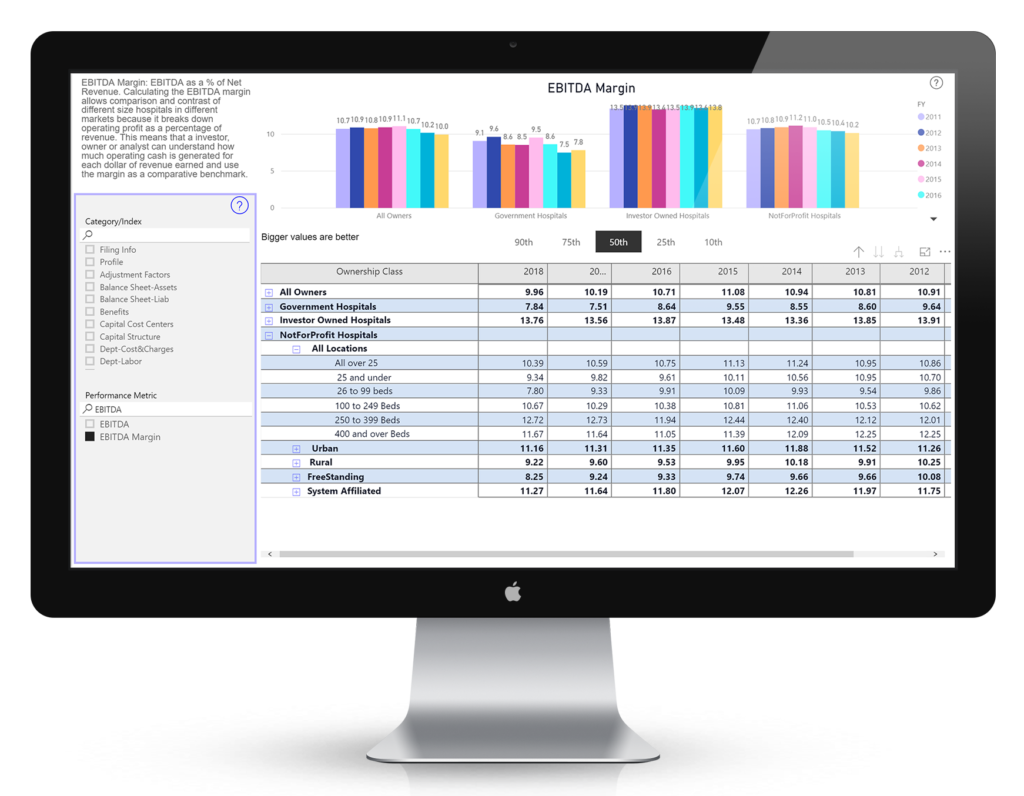
Scorecard, rank, rate, compare, benchmark against custom peer groups and individual provider profiles deep in performance history and relevance. Labor, costs, mark-ups, wages, benefits, revenues and allowances. Know everyone’s numbers and their KPIs too.
Physician Network
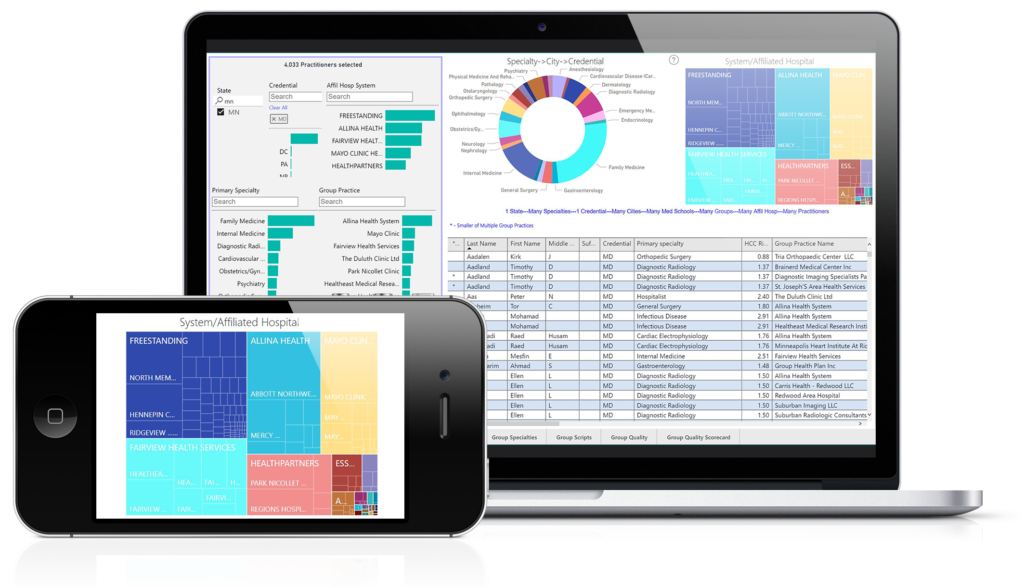
Physician and Group practice panels are increasingly transparent. Makeup of chronic patients, practice risk scores, demographics, eligibility(s), preventive measures, MIPS, CG-CAHPS experience, and relevant hospital affiliations, education and specialties offer insight into your physician relationship management.
Budgeting & Staffing
Evaluate historical expenses, operating metrics, wages and benefits at the departmental level to help build up budgets and projections for all department heads. Cross-reference changing market and competitive utilization by service lines and MSDRGs.


